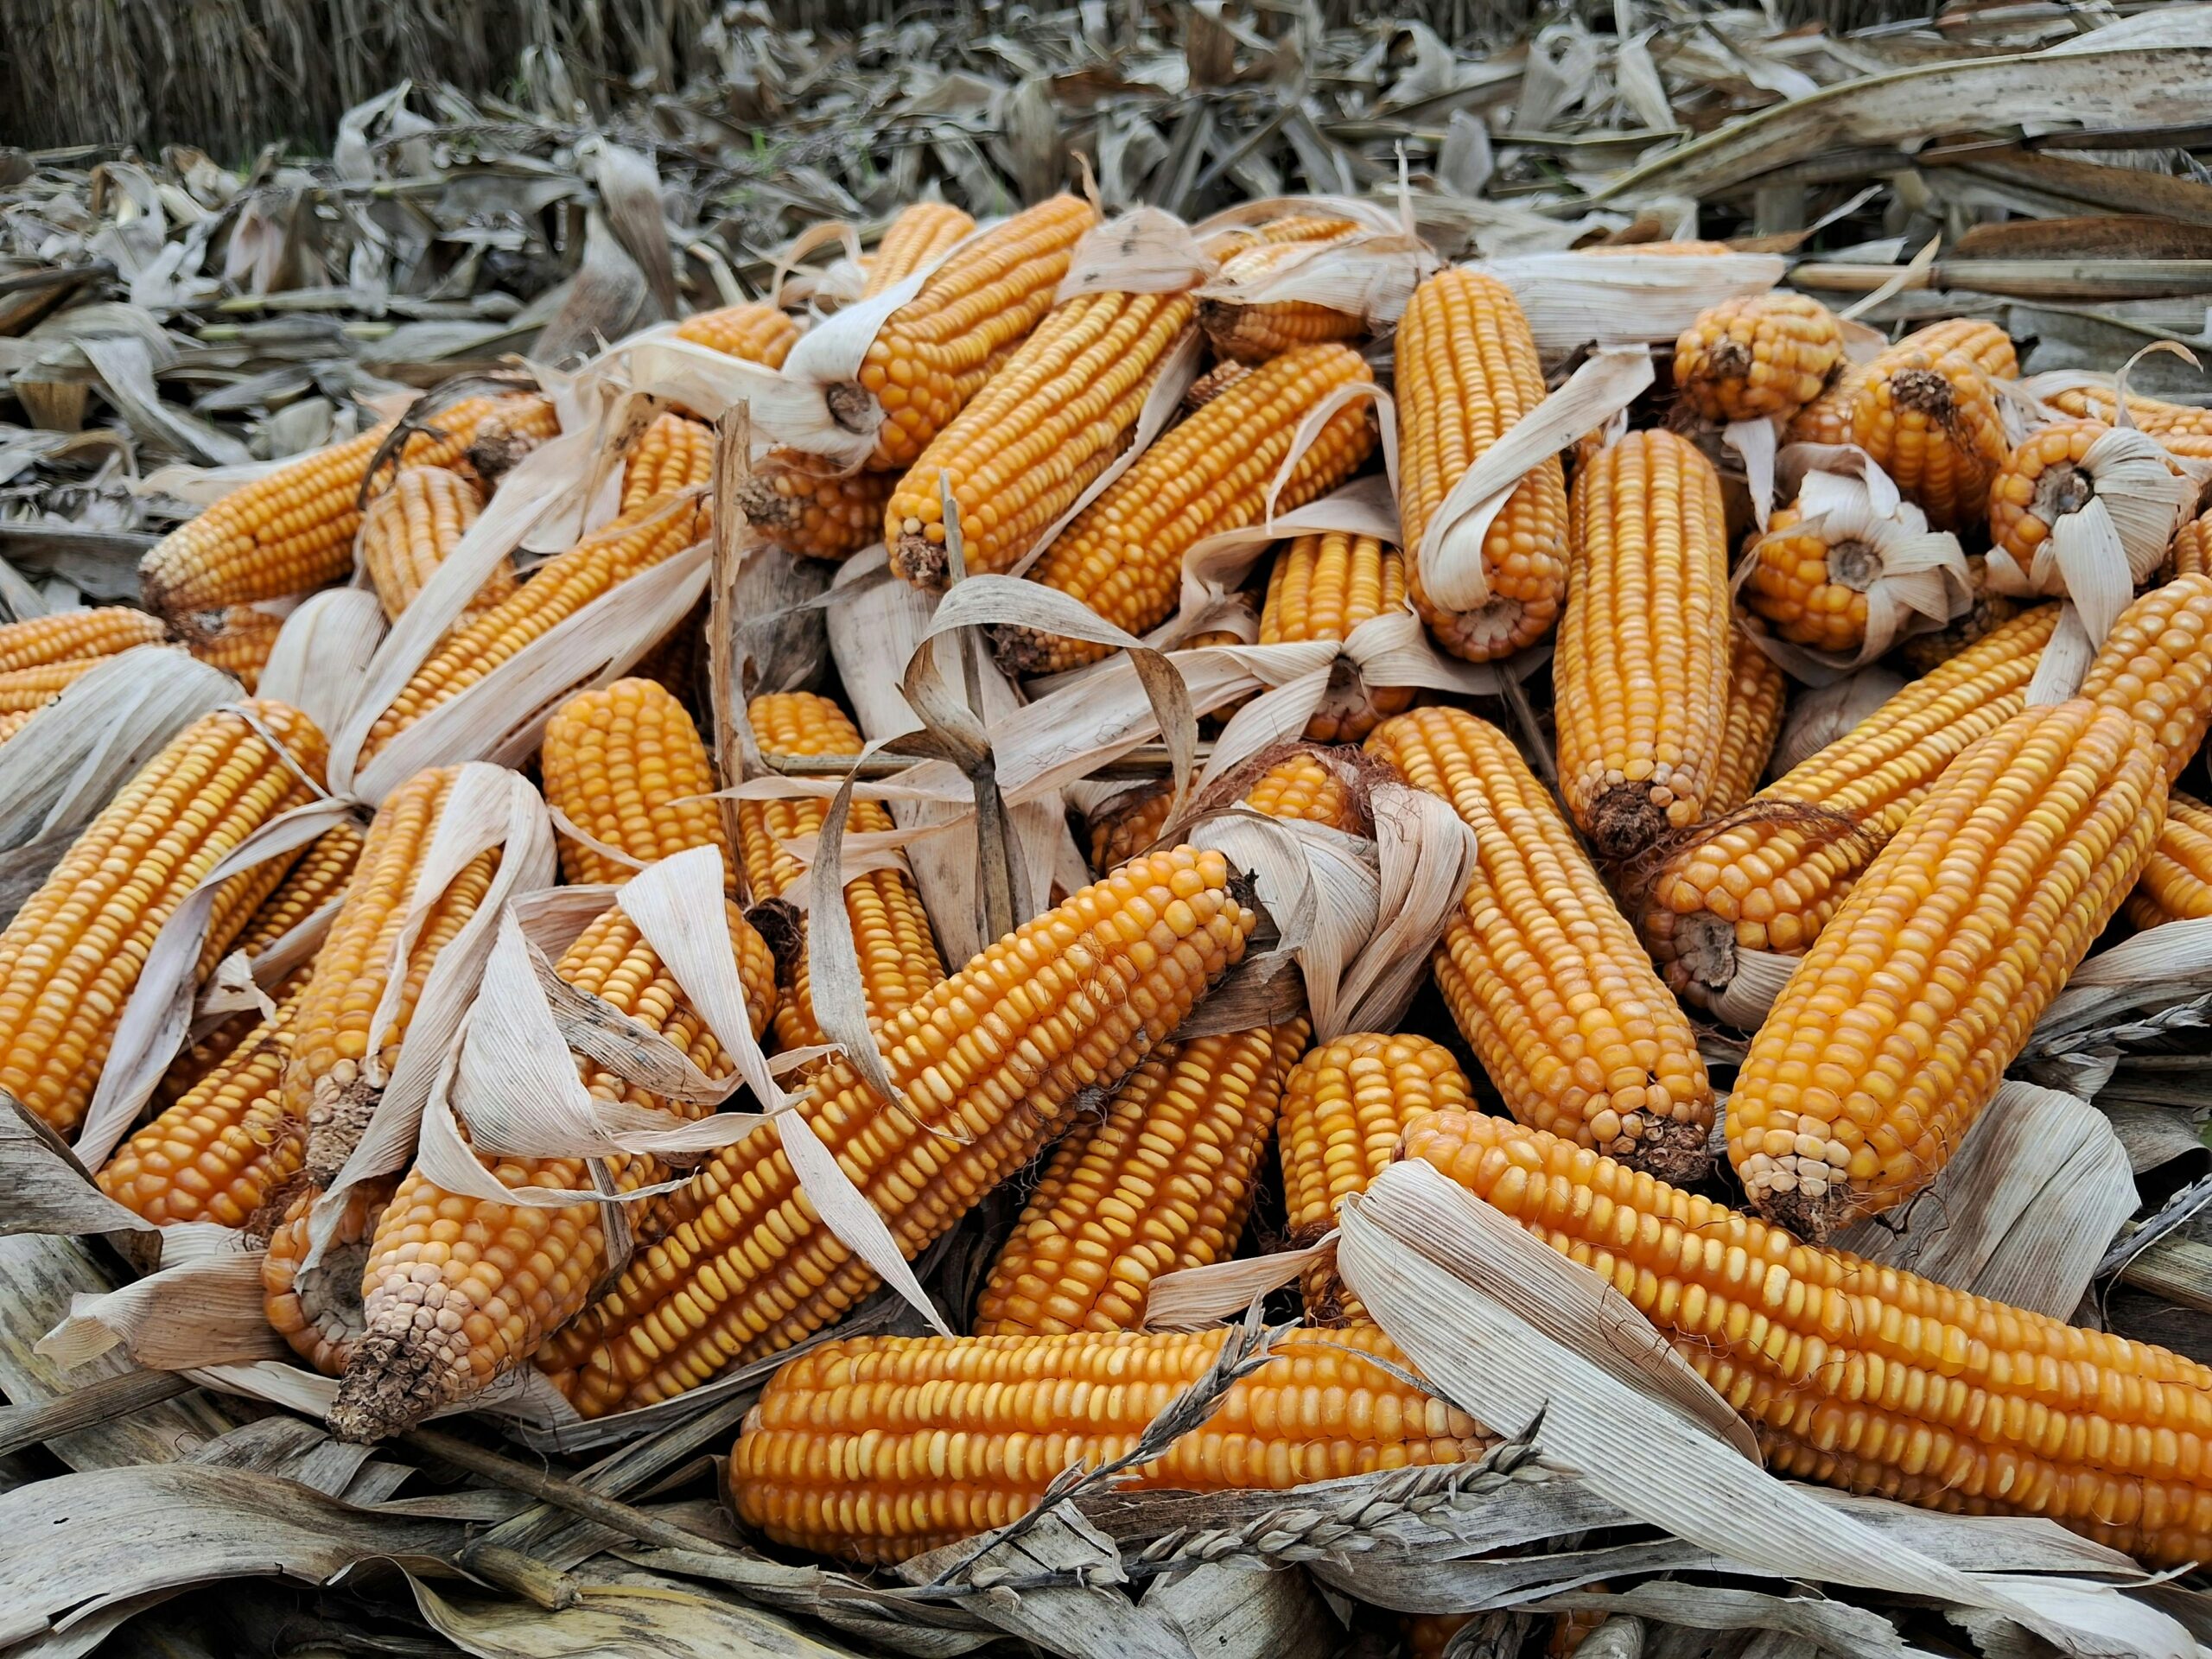
Corn (or maize) is one of the most widely produced and traded agricultural commodities globally, serving as a staple food, livestock feed, and industrial raw material. Below is a detailed breakdown of corn as a commodity:
1. Types of Corn
Corn is categorized based on its primary use:
-
Yellow Corn (Most traded) – Used for animal feed, ethanol, and processed foods.
-
White Corn – Primarily for human consumption (tortillas, snacks).
-
Sweet Corn – Consumed fresh, canned, or frozen.
-
Dent Corn – High-starch, used in industrial products.
-
Flint Corn – Harder, used for polenta and hominy.
2. Major Producers & Exporters
Top Producers (2023/24, USDA Estimates)
-
United States (~387 million metric tons)
-
China (~288 million metric tons)
-
Brazil (~137 million metric tons)
-
Argentina (~53 million metric tons)
-
Ukraine (~30 million metric tons)
Top Exporters
-
U.S. (~50% of global exports)
-
Brazil (~30%)
-
Argentina (~15%)
-
Ukraine (Pre-war: ~10%, now lower due to Black Sea disruptions)
3. Corn Futures & Trading
Corn is traded on major commodity exchanges:
-
Chicago Board of Trade (CBOT) – Benchmark for global corn prices.
-
Dalian Commodity Exchange (China) – Tracks domestic Chinese corn prices.
-
Euronext (France) – European maize futures.
Contract Size: 5,000 bushels (~127 metric tons).
Price Quote: Cents per bushel (e.g., 450¢ = $4.50/bushel).
Key Price Drivers
✔ Weather (U.S. Midwest droughts, South American rains)
✔ Ethanol Demand (U.S. mandates ~40% of corn for biofuel)
✔ China’s Imports (Major buyer for feed & reserves)
✔ USD Strength (Weak USD boosts global demand)
✔ Geopolitics (Ukraine war, Argentine export taxes)
4. Demand & Consumption
-
Animal Feed (~50%) – Poultry, swine, cattle.
-
Ethanol Production (~40% in U.S.) – Biofuel blending mandates.
-
Food & Industrial Use (~10%) – Corn syrup, starch, snacks.
5. Price Trends & Volatility
-
Historical Prices:
-
2012 Drought Spike: ~$8/bushel (U.S. shortage).
-
2020 COVID Drop: ~$3/bushel (demand collapse).
-
2022 Ukraine War Surge: ~$8/bushel (supply fears).
-
2024 Prices: ~$4.00-$4.80/bushel (high U.S. stocks).
-
Bullish Factors
-
Droughts in U.S./Brazil
-
Rising Chinese imports
-
Increased ethanol demand
Bearish Factors
-
Record U.S./Brazil harvests
-
Reduced biofuel mandates
-
Economic slowdown (less meat demand → less feed corn)
6. Investment & Trading Strategies
Ways to Trade Corn
-
Futures & Options (CBOT) – Direct exposure.
-
ETFs:
-
Teucrium Corn Fund (CORN) – Tracks corn futures.
-
Invesco DB Agriculture Fund (DBA) – Includes corn.
-
-
Stocks:
-
Archer-Daniels-Midland (ADM), Bunge (BG) – Grain traders.
-
Deere & Co. (DE), Corteva (CTVA) – Agribusiness plays.
-
Seasonal Trends
-
Planting (April-June): Prices volatile on weather risks.
-
Harvest (Sept-Nov): Typically lower prices (supply surge).
7. Risks
-
Weather Disruptions (El Niño/La Niña impacts yields).
-
Policy Shocks (U.S. ethanol rules, China import bans).
-
Currency Risk (Strong USD makes U.S. corn more expensive globally).
Conclusion
Corn is a highly liquid and volatile commodity, influenced by weather, energy policies, and global demand. Traders monitor USDA reports, South American weather, and biofuel trends to predict price movements.
